
DOI: https://doi.org/10.64010/HNEX3886
Abstract
The study is on the effects of brand experiences on brand equity in higher education: A case study at FPT University education was conducted using the quantitative research method, with a sample size of 545 students, conducted at FPT University – Cantho campus. A convenience sample was used based on study subjects’ willingness to provide information. Data analysis methods included: Cronbach alpha test, confirmation factor analysis and structural equation modeling. The research results have recognized: (i) Five components of brand experience in the higher education field, namely: sensory experience; affective experience; intellectual experience; behavioral experience; and social experience. The four categories that belong to brand experience, namely: sensory experience; affective experience; behavioral experience; and social experience, have direct, positive, and meaningful effects on the components of brand equity, including (1) brand personality, (2) brand trust, (3) brand satisfaction, (4) brand attachment, and (5) brand loyalty; and (ii) confirmed a positive, significant correlation between components of brand equity which are brand personality, brand trust, brand satisfaction, brand attachment, and brand loyalty.
Introduction
The customer-based brand equity is one of the most valuable assets that customers bring to enterprises. It shows customers’ awareness, experience, trust, satisfaction, engagement, and loyalty towards the brand. Enterprises having a strong brand equity will have a great advantage in attracting and connecting customers with its brand, creating a huge competitive advantage for businesses in the market. Therefore, building a customer-based brand equity is a strategic issue that companies must focus their resources on and do it methodically, systematically and over time. Accordingly, customers experiencing the brand will have an impact on shaping the brand equity.
In the world, there were many studies on the relationship between brand experience and elements of brand equity; typical were studies on the impact of brand experience on brand loyalty, such as Brakus et al (2009), Forrester (2009), Ishida & Taylor (2012), and Richard Chinomona (2013). Research on the relationship between brand experience and brand association showed that there was a positive correlation if customers experienced the brand well. Studies by Dolbec & Chebat (2013) in the field of fashion, Kang et al (2016) in hospitality and tourism business, Richard Huaman-Ramirez and Dwight Merunka (2019) in the entertainment and tourism, restaurants, hotels, retail, banking and entertainment (movie theaters) also recognized the impact of brand experience on brand loyalty.
In Vietnam, in recent years, there have also been studies related to the link between customer experience and brand experience. These studies demonstrated a positive correlation between brand experience and brand loyalty. (Pham Thi Lan Huong, 2016; Luu Tien Thuan & Tran Thu Van, 2014; Le Thi Thu Trang & Luu Tien Thuan, 2019; Tran Thi Hien et al, 2019; Vo Thi Ngoc Thuy, 2017). A literature review found no direct studies on the correlation between brand experience and brand equity in higher education context in Vietnam. Therefore, a study on brand experience and the relationship between brand experience and brand equity in higher education context is necessary.
Theoretical Framework and Hypotheses
Brand experience is made up of the functional, technical, and human connections brought about by a company (Berry & Carbone, 2007). Brand experience is the internal, subjective reactions of customers (such as sensory feelings, affective and perceptions) and behavioral responses due to the effects of factors related to brand structure (brand identity and recognition), environmental factors, and media effects (Brakus et al, 2009).
The concept of brand experience is researched and developed on the basis of the research of the customer experience by Holbrook & Hirschman (1982). They said that customer experience is related to happiness, fun, relaxation, and symbols. Myer & Schwager (2007) defined customer experience as the internal and subjective response a customer has to any indirect and direct interaction with the company, which occurs when a customer searches for the company, then learning about, buying, and consuming products. According to Schmitt (2010), customer experience was defined as the perception, feelings, and thoughts that customers have when they encounter products and brands in the market and engage in consumer activities. Experiences can be evoked from product, packaging, communications, in-store interactions, sales relationships, events, and can also occur as a result of live operations or offline. Thus according to Schmitt (2003) and Brakus et al. (2009) the components of experience: (1) Sensory experience, (2) Affective experience, (3) Intellectual experience, and (4) Behavior experience. The social experience component was removed in the research of Brakus et al. (2009).
But a study by Shamin & Butt (2013) identified the social experience component as a component of brand experience on mobile products. The study by Richard Huaman-Ramirez & Dwight Merunka (2019) identified the social experience components of brand experience in 10 brands in the fields of entertainment, fast food, tourism, restaurants, hotels, banks, and movie theaters. This study proposes to add to social experience components with five components identified from the research results of Brakus et al (2009), including: (1) Sensory experience, (2) Affective experience, (3) Intellectual experience, (4) Behavior experience, and (5) Social experience.
Brand equity is the strength that a brand can gain in the market by name, sign, and symbol (Farquhar, 1989). Keller (1993) argues that brand equity is a different effect of brand awareness based on customer feedback on brand marketing activities. Aaker (1991) defined brand equity as a set of values associated with the brand name or symbol. These values would be added to the product or services associated. Aaker (1991) said that there are four attributes that make up brand equity: (1) Brand awareness; (2) Brand association; (3) Perceived quality, and (4) Brand loyalty. According to Lassar et al. (1995) brand equity included: (1) Perceived quality, (2) Perceived value, (3) Brand impression, (4) Consumer brand trust, and (5) Customer perception of the brand.
Brand experience would influence brand trust and brand loyalty through the customers’ emotions, contexts, and interaction with the brand (Shin et al, 2011). Research by Chaudhuni and Holbook (2001) confirmed the positive relationship between brand experience and brand trust. Research by Brakus et al (2009) and Choi et al (2011) also indicated a positive relationship between brand experience and perceptions of brand personality. Accordingly, this study proposes to analyze the impact of brand experience on brand equity based on the brand equity theory of Aaker (1991) and Lassar et al (1995) to establish components of brand equity in the higher education sector, including: (1)
Brand personality, (2) Brand trust, (3) Brand satisfaction, (4) Brand attachment, and (5) Brand loyalty.
Brand personality is a set of human attributes associated with a brand (Aaker, 1999). According to Moore (2003), brand personality is a set of emotional traits used to shape a brand. Thus, the typical characteristics of people are used to shape the brand’s personality, such as sincerity, warmth, trustworthiness, safety, and creativity, thus suggesting brand personality has an impact on customer loyalty to the brand. Research by Pham Anh Tuan (2008) showed the positive impact of brand personality on customer loyalty to the real brand. Research by Ho Bach Nhat and Huynh Anh Dung (2017) also identified a positive relationship between brand personality and brand loyalty.
Brand trust is the consumer’s willingness to rely on the strength of a brand to execute behavioral intention (Marzocchi et al, 2013). Brand trust is a psychological variable based on a set of assumptions related to the trustworthiness, integrity and benevolence that consumers attribute to the brand (Gurviez & Korchia, 2003). Brand trust creates a positive image in the minds of customers about the product and drives behavior (Nguyen Quang Thu & Luu Thi Kim Tuyen, 2017). Research by Corbitt et al (2003); Pavlou and Fygenson (2006); and Nguyen Quang Thu and Luu Thi Kim Tuyen (2017) had identified the components of brand trust: (1) responsibility in terms of customer benefits, (2) honesty in providing information about brand quality, (3) brand trustworthiness, (4) performance commitment, and (5) meets expectations.
The study was based on the brand trust scale of Corbitt et al. (2003), Pavlou & Fygenson (2006) to design a scale of brand trust in the higher education sector, including: trust in brand benefits, honesty, reliability, ability to fulfill a commitment, and ability to meet expectations.
Brand satisfaction is the emotional response of a customer regarding the difference between expectations of a product before and after using good or service (Oliver, 1980; Engel et al, 1990). Customer satisfaction is actually the customers’ evaluatation of the service quality (Gus-tafsson et al, 2005). Research by Nguyen Thanh Long (2006) had identified variables of satisfaction with the quality of higher education, including: (1) Teaching activities, (2) Extracurricular activities, (3) Environment study, research, and (4) The right decision to study at school. The current study uses a scale of brand satisfaction designed for higher education by Nguyen Thanh Long (2006).
Brand attachment refers to the sustainable emotional response and the connection between the customer and the brand (Lacoeuilhe, 2000). Heilbrunn (2001) and Thomson et al (2005) emphasized that brand bonding is a strong and positive emotional relationship between customers and brands. The emotional relationship between the customer and the brand is established through the interdependent characteristics of the customer and the brand (Cristau, 2001). Thus, brand attachment refers to the relationship between consumers and a brand that is seen as the relationship between two entities. In addition to a physical ownership relationship, there is an emotional relationship. If brand experience is good, it has a positive effect on brand cohesion. This study proposes to use the brand attachment scale by Lacoeuilhe J. (2000), with the observed variables: brand affinity; fun; peace of mind; attachment; and brand attraction.
Brand loyalty, when a customer is loyal, he or she will talk well about the brand, introduce the brand to others, and always intend to own a brand, even buy multiple products of the same brand (Jonhson et al, 2005). A study by Jagdish N. Sheth & C. Whan Park (1974) showed that brand loyalty denotes the retention of a product to a brand in the future of the customer loyalty and brand loyalty were studied in two aspects: (1) In terms of attitude, it is the first intention to choose that brand in consumption (Oliver, 1999); and (2) In terms of behavior, it refers to the degree of consumer retention in a certain brand (Javalgi & Moberg, 1997). Boz-zo et al (2006) did research in three types of customers: (i) loyal customers; (ii) customers with ambiguous attitudes, and (iii) loyal customers, the result gotten in a recognition of loyal customers with a closer connection with the brand. This showed that there is a positive correlation between brand attachment and brand loyalty. Based on these findings, this study proposes to use the brand loyalty scale by Jonhson et al (2006).
Brand loyalty: when a customer is loyal, he or she will talk well about the brand, introduce the brand to others, and always intend to own a brand, even buy multiple products of the same brand (Jonhson et al, 2005). A study by Jagdish N. Sheth and C. Whan Park (1974) showed that brand loyalty denotes the retention of a product to a brand in the future of the customer (Oliver, 1999) and loyalty; and brand loyalty was studied in two aspects: (1) in terms of attitude, it is the first intention to choose that brand in consumption (Oliver, 1999); and (2) in terms of behavior, it refers to the degree of consumer retention in a certain brand (Javalgi & Moberg, 1997). The research result of Bozzo et al (2006) confirmed loyal customers with a closer connection with the brand. This showed that there was a positive correlation between brand attachment and brand loyalty. Based on these findings, this study proposes to use the brand loyalty scale by Jonhson et al. (2006).
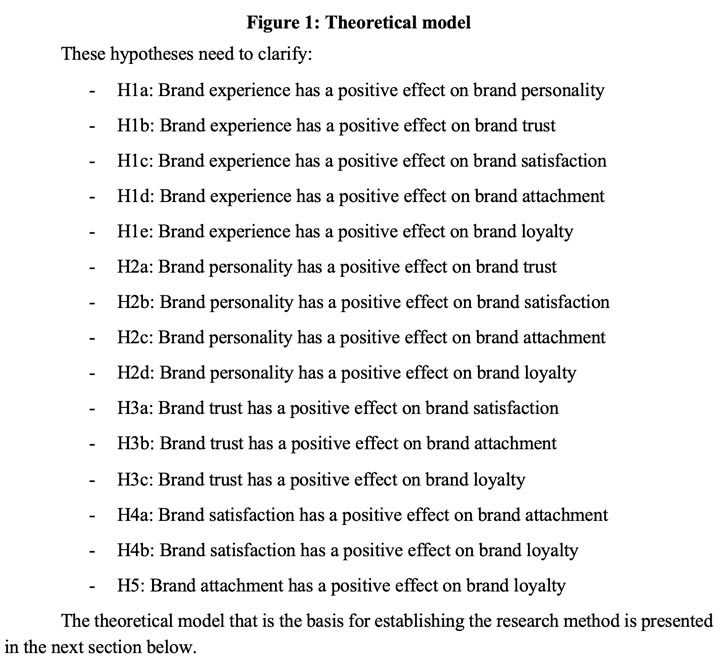
Based on the literature reviewed above, the theoretical model is proposed as in Fig. 1:
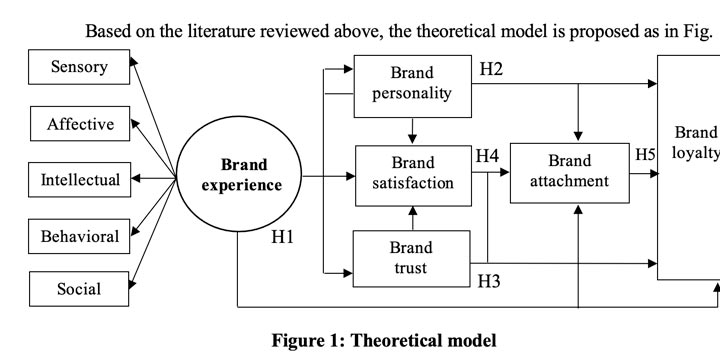
Research Methods
The research was implemented on the basis of the theoretical model proposed in Figure 1, whereby the scales of the components of brand experience and brand equity would be designed into questions to collect primary data. Likert scale with 5 levels, from 1: Strongly disagree to 5: Strongly agree was used to design questions. The steps for implementing the research were as follows:
Step 1: Qualitative research was done by in-depth discussion with school administrators and students to determine brand personality, factors related to student demographics and semantic contents of each variable in the scales. This was for the purpose of designing quantitative research questionnaires.
Step 2: Quantitative research was conducted on 100 students studying at FPT University-Can Tho campus. An online questionnaire was designed on the Google forms platform and links were sent to students to complete the questionnaire. The research results of step 2 served to validate the questionnaire and test the scales of brand experience, brand personality, brand trust, brand satisfaction, brand attachment, and brand loyalty.
Step 3: Quantitative research was conducted on students studying at FPT University- Can Tho branch. The proposed sample size was 545 students (accounting for 22.15% of the total) studying at the FPT Unver-sity-Can Tho campus. Proposed sample structure: 50% of students are in business administration (accounting for nearly 40% of students of the whole school), and 50% of the sample is divided equally among the other two sectors, which are information technology and language. Samples were selected by the convenience method, based on students’ willingness to participate in the study. Online questionnaires created on Google forms was sent to all students via email and on Facebook to invite students to participate in the survey. At the same time, questionnaires were given to students to complete and immediately return to the researcher.
The time to collect primary data was from June to August 2020. The data was filtered and analyzed by SPSS and AMOS softwares. Data analysis methods included: Cronbach alpha test to assess the reliability of the scale, Confirmatory Factor Analysis (CFA) to determine the components of brand experience in higher education context, and Structural Equation Modeling (SEM) to test the correlation of brand experience to brand personality, brand trust, brand satisfaction, brand attachment and brand loyalty. The relationship test results will provide the basis for the conclusion of the proposed research hypotheses.
Research Results
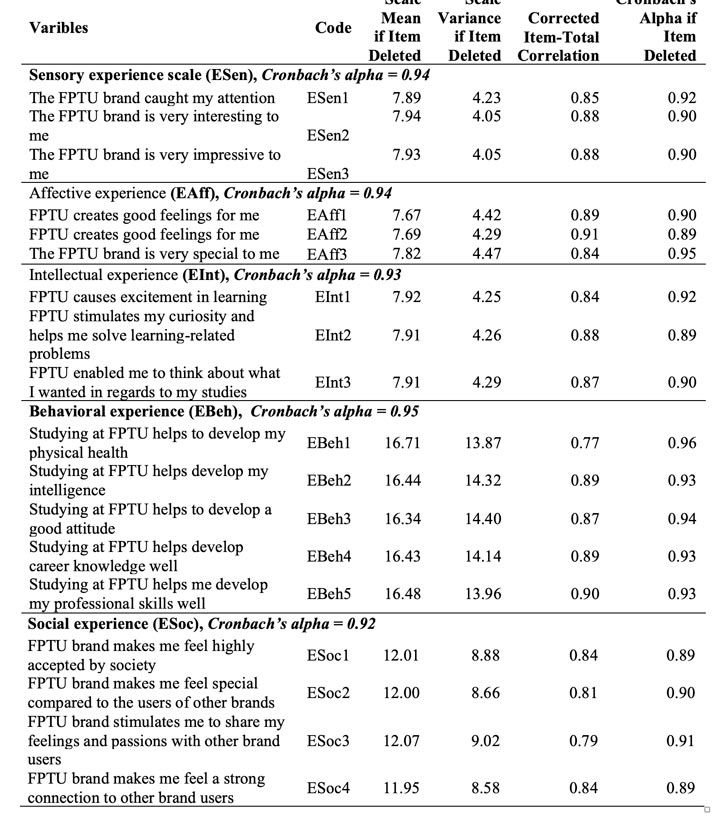
To test the reliability of the scale of five components of brand experience, Cronbach’s alpha reliability coefficient was calculated and the results are displayed in Table 1. The correlation of the observed variables to the total variable include: (1) sensory experience (ESen); (2) affective experience (EAff); (3) intellectual experience (EInt); (4) behavioral experience (EBeh); and (5) social experience (ESoc). Table 1 shows Cron-bach’s alpha coefficients ranging from 0.92-0.95 and are all greater than 0.8, demonstrating the relationship of observed variables with the total variable achieves reliability. In addition, the correlation coefficient of each observed variable with the total variable is greater than 0.3 (Nunnally & Burnstein, 1994), the correlation of the component variable and the total variable is high, suggesting the scale has high reliability.
The five components of brand experience in the higher education context, including (1) sensory experience (ESen); (2) affective experience (EAff); (3) intellectual experience (EInt); (4) behavioral experience (EBeh); and (5) social experience (ESoc) was further analyzed by the method of confirmatory factor analysis (CFA), and the results were as follows:
The relevance of the model: the result of Chi-square/df = 3.56 < 5.0 (Chin & Todd, 1995); TLI = 0.97 and CFI = 0.98 are both greater than 0.90 (Segar & Grover, 1993; Chin & Todd, 1995); RMSEA = 0.069 < 0.08 (Taylor et al, 1993), factor analysis confirmed the relevance of the model.
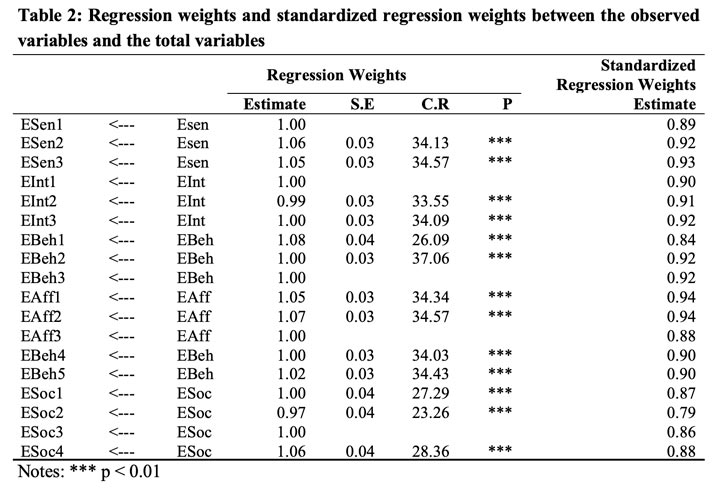
The convergence value, Table 2 of the estimate – regression weights are all greater than 0 and are statistically significant with 99.99% confidence (P < 0.01) and the standardized regression weights are all higher than 0.5, showing that the scales reach convergent values (Gerbring & Anderson, 1988).
Unidirection, the five components of brand experience, including: (1) Sensory experience (ESen); (2) Affective experience (EAff); (3) Intellectual Experience (EInt); (4) Behavioral experience (EBeh); and (5) Social experience (ESoc) have no correlation between the errors among the components, the scales are unidirectional (Steenkamp & Van Trijp, 1991).
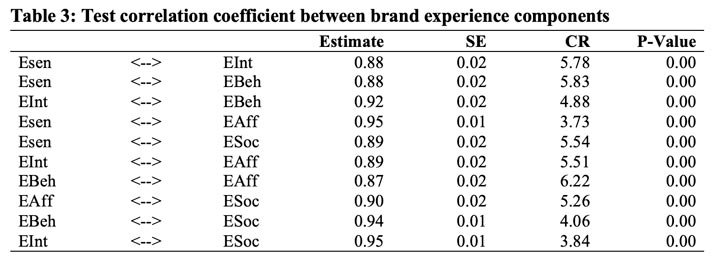
Distinguishing values, presented in Table 3, correlation coefficients between components: sensory experience (ESen); (2) affective experience (EAff); (3) intellectual experience (EInt); (4) behavioral experience (EBeh); and (5) social experience (ESoc) are all smaller than 1.0 (P < 0.01), these components are of distinctive value.
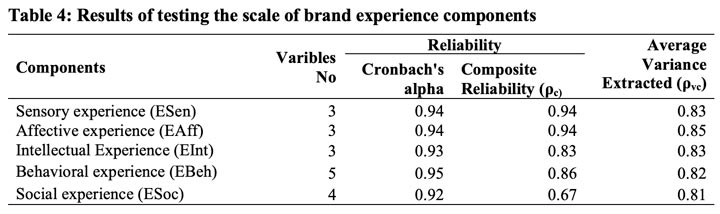
The reliability and total variance explained in Table 4, show that Cronbach’s alpha coefficients are all greater than 0.6 (Nunnally & Burnstien, 1994) and the Composite reliability (ρc) are both greater than 0.5 (Schumacker & Lomax, 2006) and Average Variance Extracted (ρvc) are both greater than 0.5 (Hair et al, 1998), so the scale is reliable.
Factor analysis results confirmed five components of brand experience including: (1) sensory experience (ESen); (2) affective experience (EAff); (3) intellectual experience (EInt); (4) behavioral experience (EBeh); and (5) social experience (ESoc). The observed variables are correlated closely with the total variables in each group of factors; the correlation coefficients are all very high, and the scale is reliable.
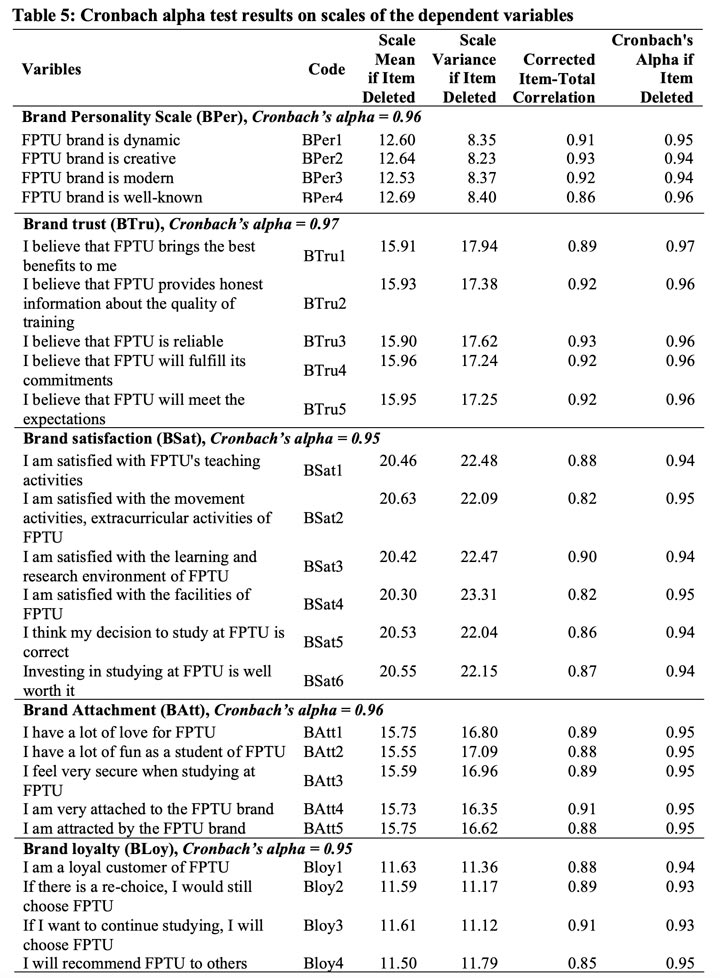
The study continues to analyze the correlation between brand experience (including five component variables, which are independent variables) and component variables of brand equity (dependent variable) including: (1) brand personality; (2) brand trust; (3) brand satisfaction; (4) brand attachment; and (5) brand loyalty. The Cronbach alpha test results for the dependent variables was summarized in Table 5, showing Cronbach’s alpha coefficients of the scales ranging from 0.95-0.97, all higher than 0.80 showing that the relationship of the observed variables with the total variable suggests high reliability. In addition, the correlation coefficient of each observed variable to the total variable is greater than 0.3 (Nunnally & Burnstein, 1994), the correlation of the component variable and the total variable is high, again suggesting the scale has high reliability.
The results of Structural Equation Modelling (SEM), with the independent variable intellectual experience (EInt) excluded from the model, there were four significant components remaining: sensory experience (ESen); affective experience (EAff); behavioral experience (EBeh); and social experience (ESoc). Analytical results were: Chi-square/df = 3.67 < 5.0 (Kettinger & Lee, 1995); TLI = 0.94 and CFI = 0.95 are both greater than 0.90 (Segar & Grover, 1993; Chin & Todd, 1995); RMSEA = 0.07 ≤ 0.07 (Taylor et al, 1993) the structural equation modelling analysis of the correlation between the independent variables of brand experience and the dependent variables of brand equity showed a good fit.
From the results of SEM analysis, positive and significant correlations between components of brand experience and brand equity were confirmed; thereby the research hypotheses (Table 7) accepted the following hypotheses: H1a-1e; H2a; H3a-3b; H4a-4b. Hypotheses: H2b-2d; H3c and H5 were rejected.
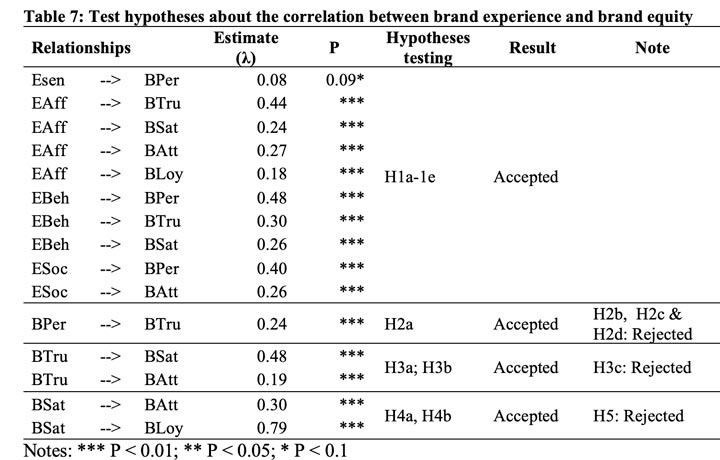
The analysis results have identified the components of brand experience: sensory experience (ESen); affective experience (EAff); behavioral experience (EBeh); and social experience (ESoc) having a direct, positive, and meaningful impact with a confidence level of 90% or more on the components of the brand equity: brand personality (BPer); brand trust (BTru); brand satisfaction (BSat); brand attachment (BAtt); and brand loyalty (BLoy). In addition, the components of the brand equity also have a positive effect on each other in the model. Specifically, the impact of the components is explained:
- ESen, EBeh and ESoc components explained 89% of the variation of BPer and the impact level on BPer is 0.08 *; 0.48 *** and 0.40 ***. 15
- EAff, EBeh and BPer explained 88% of the variation of BTru and the impact level on BTru respectively: 0.44 ***; 0.40 *** and 0.24 ***.
- EAff and EBeh explained 90% of the variation of BSat and the level of impact on BSat respectively: 0.24 *** and 0.26 ***.
- EAff; ESoc; BTru and BSat explained 96% of the variation of BAtt and the impact level on BAtt respectively: 0.27 ***; 0.26 ***; 0.19 *** and 0.30 ***.
- EAff and BSat explained 96% of the variation of BLoy and the level of impact on BLoy respectively: 0.18 *** and 0.79 ***.
Research results have showed the very important role of brand experience in building brand equity in higher education contexts. Brand experience not only directly brings value to customers, creates interaction and connection between customers and a brand name, but also contributes positively to the strategy of building brand equity for universities.
Conclusion
This study on the impact of brand experience on brand equity in higher education using a case study at FPT University-Can Tho campus was conducted using quantitative research methods with a sample size of 545 current students. The research results have recognized five components of brand experience in the higher education field, namely: sensory experience; affective experience; intellectual experience; behavioral experience; and social experience. These components have direct, positive, and meaningful effects (with a confidence level of 90% or more) on the components of brand equity, including: (1) brand personality; (2) brand trust; (3) brand satisfaction; brand attachment; and brand loyalty, and confirmed a positive, significant correlation between components of brand equity which are brand personality, brand trust, brand satisfaction, brand attachment, and brand loyalty.
The research results have shown the important role of brand experience, which not only directly brings value and experience to customers, but also actively contributes to the creation of brand equity, increases customer engagement with the brand, and has a positive viral effect on brand communication. The results of this research set up a spring board for universities in designing activities to improve student experience in the learning process, and promote brand equity for universities.
Acknowledgments
The author send my thanks to FPT University: This work is supported by the research project No. ĐHFPT/2020/03 granted by FPT University.
References
- Aaker, D. A. (1991). Managing Brand Equity: Capitalizing on the value of a brand name. New York, The Free Press, 1st ed.
- Berry, L.L., Wall, E.A. and Carbone, L.P. (2006), “Service clues and customer assessment of the service experience: Lessons from marketing”, The Academy of Management Perspectives , Vol. 20 No. 2, pp. 43-57
- Brakus, J. Jos˘ko, Bernd H. Schmitt, and Lia Zarantonello. (2009). Brand experience: What is it? How is it measured? Does it affect loyalty?Journal of Marketing Vol. 73 (May 2009), 52–68
- Bozzo, C., Merunka D. & Moulins, J. L. (2006). Peu de consommateurs fidèles habitent au paradis, Actes du Congrès Marketing Trends, Janvier, Venise, CD-Rom
- Chaudhuri, A., and Holbrook, M. B. (2001). The chain of effects from brand trust and brand affect to brand performance: The role of brand loyalty. Journal of Marketing, 65, 81-93.
- Chin, W. W., and Todd, P. A. (1995). On the Use, Usefulness, and Ease of Use of Structural Equation Modeling in MIS Research: A Note of Caution. MIS Quarterly. Vol. 19, No. 2: 237-246
- Corbitt, B. J., Thanasankit, T., & Yi, H. (2003). Trust and e-commerce: A study of consumer perception. Electronic Commerce Research and Applications, 2, 203–215
- Cristau, C. (2001). Définition, Mesure et Modélisation de l’Attachement à la Marque avec Deux Composantes: La Dépendance et l’Amitié vis-à-vis d’une Marque. Thèse de ProvenceDoctorat en Sciences de Gestion, IAE d’Aix en
- Dolbec, P.Y. and Chebat, J.C. (2013), “The impact of a flagship vs. a brand store on brand attitude, brand attachment and brand equity”, Journal of Retailing, Vol. 89 No. 4, pp. 460–466.
- Doney, P.M. and Cannon, J.P. (1997). “An examination of the nature of trust in buyer-seller relationships”, Journal of Marketing, Vol. 61 No. 2, pp. 35-51.
- Engel, J.F., Blackwell, R.D. & Miniard, P.W. (1990). Consumer Behavior, 6th ed. The Dryden Press, Chicago, IL
- Farquhar, P. H. (1989). Managing brand equity. Marketing Research, Vol.1, No. 9, pp. 24-33.
- Gerbing, D. W. and Anderson, J. C. (1988). An Updated Paradigm for Scale Development Incorporating Unidimensionality and It’s Assessment. Journal of Marketing Research 25 (2): 186-192.
- Gustafsson, A., Johnson, M.D. & Roos, I. (2005). The Effect of Customer Satisfaction, Relationship Commitment Dimensions, and Triggers on Customer Retention. Journal of Marketing, 69(10): 210-218
- Gurviez, P. & Korchia, M. (2003). Test of consumer-brand relationship model including trust and three consequences. International Research Seminar in Marketing, 30, 359-374.
- Hair, Jr. J. F., Anderson, R. E., Tatham, R.L. and Black, W. C. (1998). Multivariate Data Analysis 5th edition. Prentice-Hall, Upper Saddle River
- Heilbrunn, B. (2001). Les Facteurs d’Attachement du Consommateur à la Marque. Thèse de Doctorat en Sciences de Gestion, Université Paris IX Dauphine
- Ho Bach Nhat and Huynh Anh Dung. (2017). The influence of brand personality factors on the loyalty of hungry customers with motorcycle products. An Giang University Journal of Science, Vol. 17 (5), 22-29. Holbrook, Morris B. and Elizabeth C. Hirschman. (1982). The Experiential Aspects of Consumption: Consumer
- Fantasies, Feelings, and Fun. Journal of Consumer Research, 9 (September). 132-40.
- Ishida, C. and Taylor, S. a. (2012). Retailer brand experience, brand experience congruence, and consumer satisfaction. Journal of Consumer Satisfaction, Dissatisfaction and Complaining Behavior, 25, pp. 63-79.
- Kaiser (1974). An index of factor simplicity. Psychometrika. 39: 31-36
- Kang, J., Manthiou, A., Sumarjan, N. and Tang, L. (2016),“An Investigation of Brand Experience on Marketing & Management, Vol. 26 No. 1, pp. 1-22.Brand Attachment, Knowledge, and Trust in the Lodging Industry”, Journal of Hospitality
- Kettinger, W. J., Lee, C. C. and Lee, S. (1995). Global Measures of Information Services Quality: A Cross-National Study. Decision Sciences (26:5): 569-588.
- Lacoeuilhe J. (2000). L’attachement à la Marque: Proposition d’une Echelle de Mesure. Recherche et Applications en Marketing, 15(4), 61-77.
- Lassar, W, Mittal, B and Sharma, A. (1995). Measuring customer based brand equity. Journal of Consumer Marketing, Vol.12, No.4, pp. 11-19.
- Le Thi Thu Trang and Luu Tien Thuan (2019). Influence of customer relationship management and customer experience management on customer satisfaction and loyalty: The case of supermarkets in Can Tho City. Journal of Commercial Science. Number 135: 51-60
- Luu Tien Thuan and Tran Thu Van. (2014). Research and evaluate the quality of customer experience at supermarkets in Can Tho city. Can Tho University Journal of Science. No 35: 87-96
- Marzocchi, G., Morandin, G. & Bergami, M. (2013). Brand communities: loyal to the community or the brand? European Journal of Marketing, 47(1/2), 93-114.
- Meyer, C. and Schwager, A. (2007). Understanding customer experience. Harvard Business Review, Vol. 85 No. 2, pp. 116-126.
- Moore, R. (2003). Brand for leadership. Young publishers.
- Nguyen Quang Thu and Luu Thi Kim Tuyen. (2017). The role of social influencing factors in the relationship with beliefs, attitudes, and risk perception to consumers’ online shopping intentions in the Ho Chi Minh City. Asian Journal of Economic and Business Study. 29 (01): 05-21
- Nguyen Thanh Long (2006). Use the SERVPERF measure to evaluate the quality of university training. Scientific Journal of An Giang University, 27: 19-23
- Nunnally, J. & Berstein, I.H. (1994). Pschychometric Theory, 3rd ed., New York: McGraw-Hill.
- Oliver, R.L. (1999). Whence Consumer Loyalty. Journal of Marketing. 63: 33-44
- Pavlou, P. A. (2003). Consumer acceptance of electronic commerce: Integrating trust and risk with the technology acceptance model. International Journal of Electronic Commerce, 7(3), 69-103
- Pham Anh Tuan. (2008). The impact of brand personality factors on customer loyalty: A case study of the Vietnamese mobile phone market. Economic master thesis. University of Economics Ho Chi Minh City
- Richard Chinomona (2013). The Influence Of Brand Experience On Brand Satisfaction, Trust And Attachment
- In South Africa. International Business & Economics Research Journal, Volume 12, Number 10, P. 1303-1316.
- Richard Huaman-Ramirez and Dwight Merunka. (2019). Brand experience effects on brand attachment: the role of brand trust, age, and income. European Business Review. Emerald, 31 (5), pp.610-645
- Şahin, A., Zehir, C., and Kitapçi. (2011). The effects of brand experiences, trust and satisfaction on building brand loyalty: An empirical research on global brands. In the proceedings of 7th international strategic management conference.
- Schmitt B., 2010. Experience marketing: concepts, frameworks and consumer insights. Foundations and Trends® in Marketing, 5 (2), pp. 55 – 112.
- Schumacker, R. E. & Lomax, R. G. (2016). A beginner’s guide to structural equation modeling (4th ed.). New York: Routledge
- Segar, A. H., and Grover, V. (1993). Re-examining Perceived Ease of Use and Usefulness: A Confirmatory Factor Analysis. MIS Quarterly (17:4): 517-525
- Shamim, A. and Butt, M.M. (2013). A critical model of brand experience consequences”, Asia Pacific Journal of Marketing and Logistics. Vol. 25 No. 1, pp. 102-117.
- Steenkamp, J.-B.E.M. and H.C.M. Van Trijp. (1991). The use of LISREL in validating marketing constructs.
- International Journal of Research in Marketing 8, 283-299
- Taylor, S., Sharland, A., Cronin, J. and Bullard, W. (1993). Recreational Service Quality in the International
- Setting. International Journal of Service Industry Management. 4: 68-86.
- Thom son, M., MacInni s, D.J. and Park, C.W. (2005). The ties that bind: measuring the streng th of consumers’ emotional attachments to brands. Journal of Consumer Psychology, Vol. 15 No. 1, pp. 77-91
- Tran Thi Hien, Ngo Thi Thuy and Nguyen Hong Quan (2018). Customer experience, perceived value and satisfaction. Journal of Economy & Development. Number 266: 53-62
- Vo Thi Ngoc Thuy. (2017). The impact of service experience on the following behavior: The case of long-distance passenger car service. Journal of Science – Hue University. Episode 126. Number 5A. pp. 17-28
- Jagdish N. Sheth and C. Whan Park (1974). A Theory of Multidimensional Brand Loyalty. in NA – Advances in Consumer Research. Volume 01, eds. Scott Ward and Peter Wright, Ann Abor, MI: Association for Consumer Research, pp: 449-459.